Evaluation results of 5 LD models
Average results
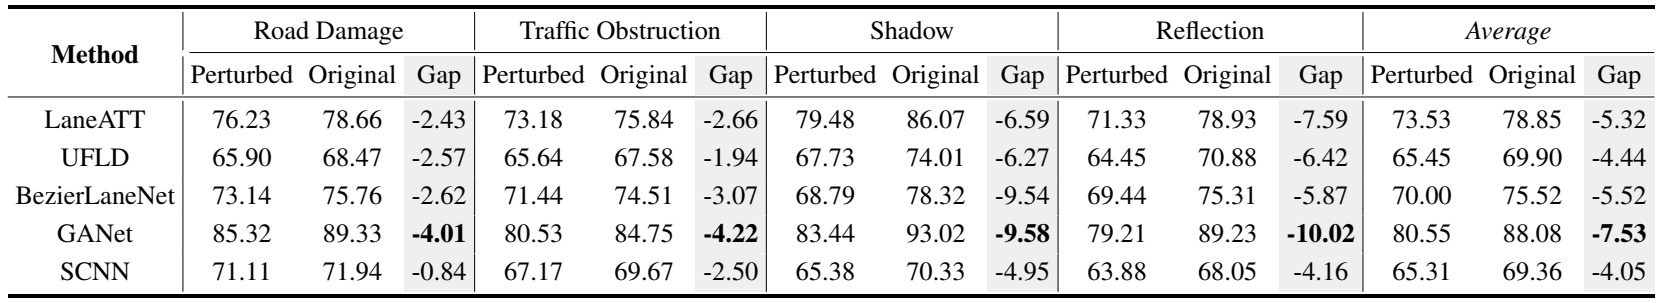
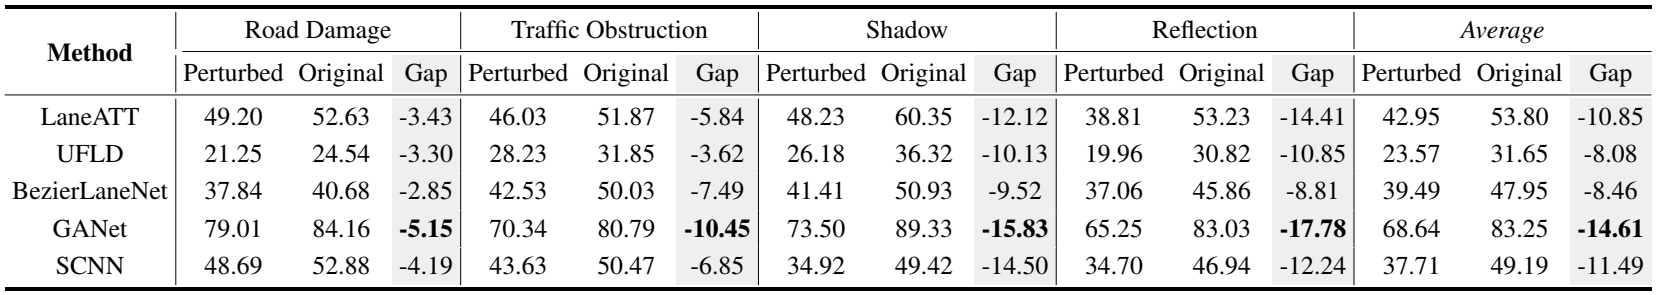
Table1 shows the average results of 4 illusion categroies. The first 4 LD modeles use Resnet-18 while SCNN uses VGG. The bold values represent the minimum in each column, and “Gap” is computed by “Perturbed” minus “Original”.
| Table 1. The evaluation results of 4 illusion categories (%). |
|---|
(a) Accuracy results (%).
|
(b) F1-score results (%).
|
Breakdown results
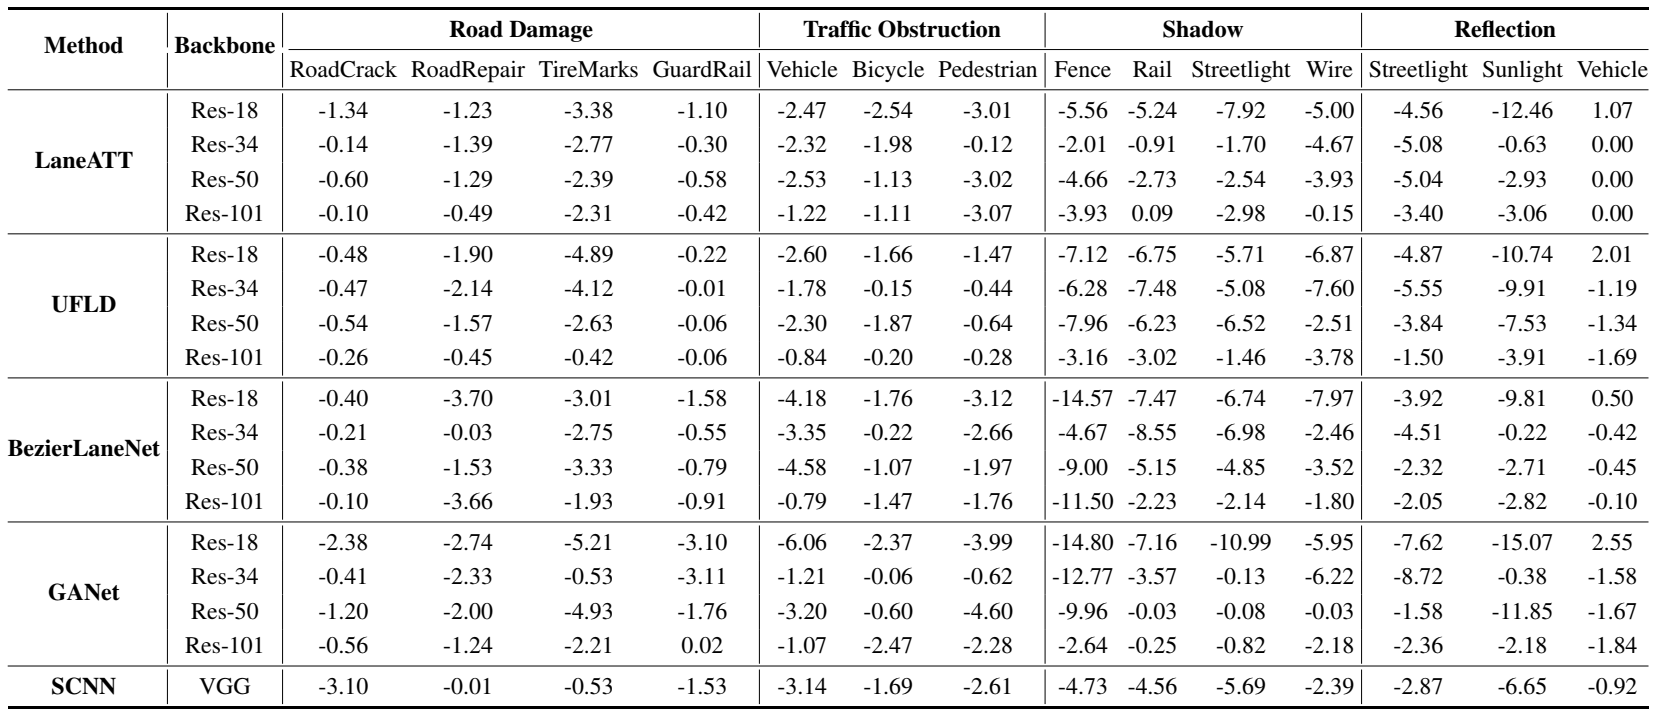
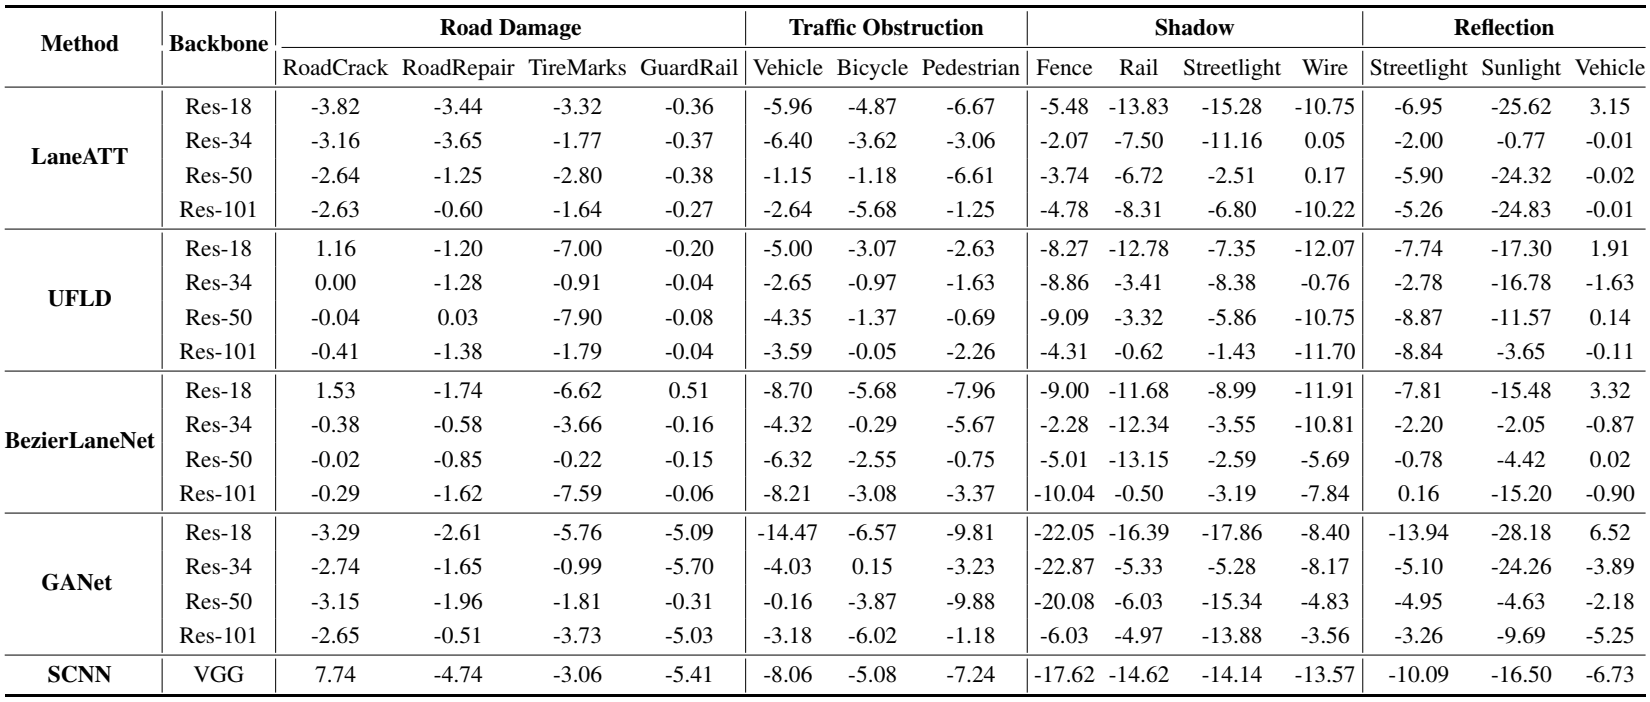
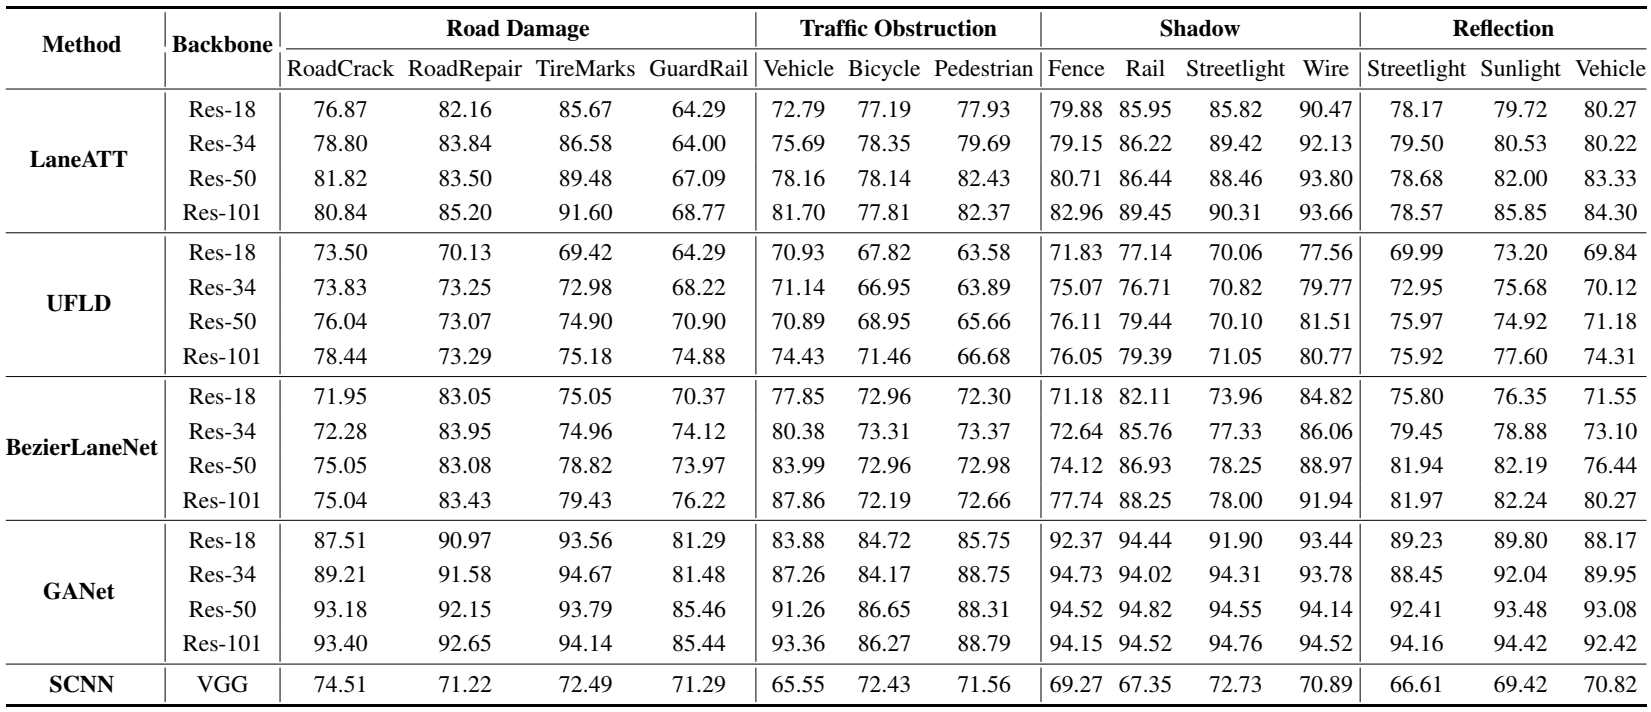
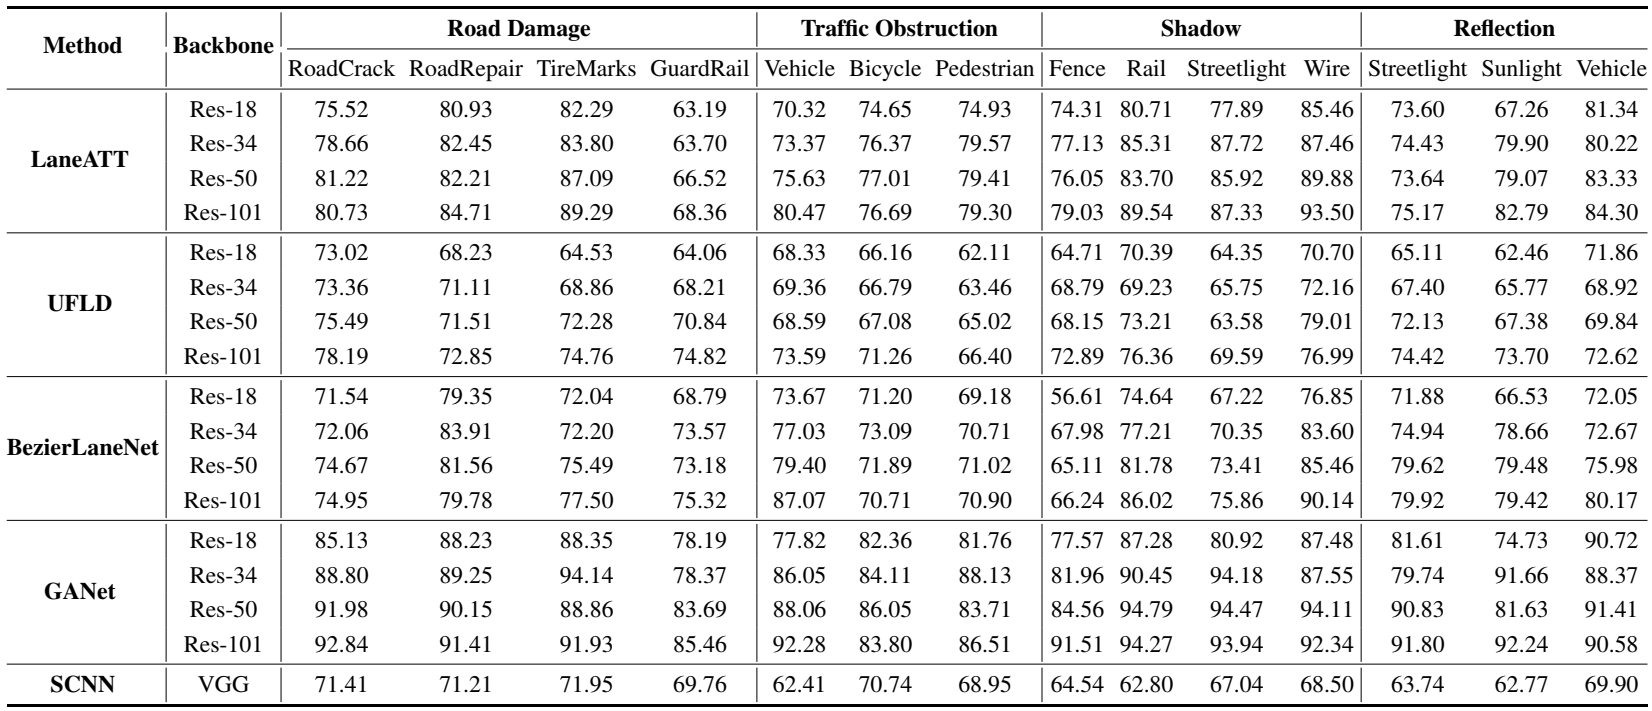
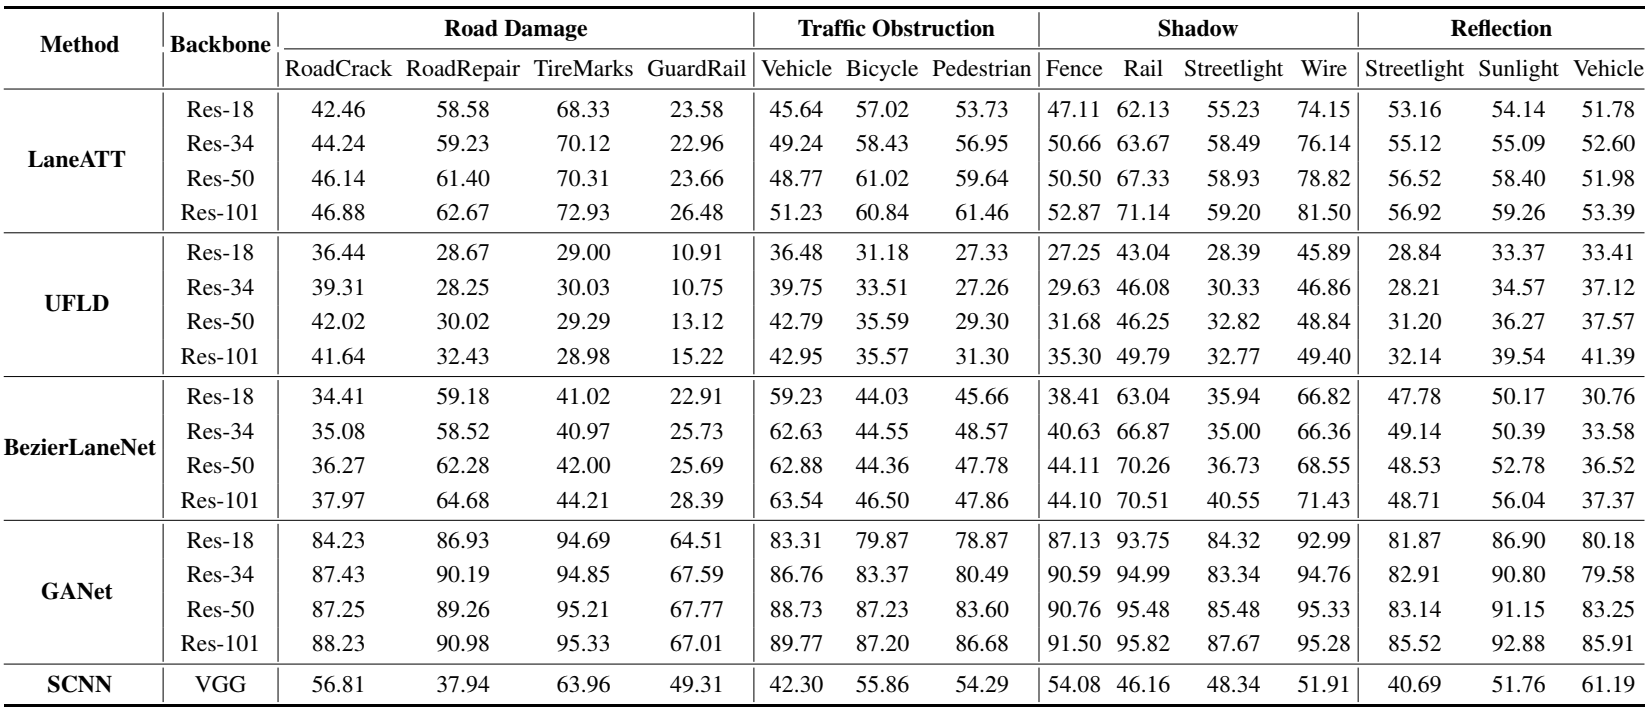
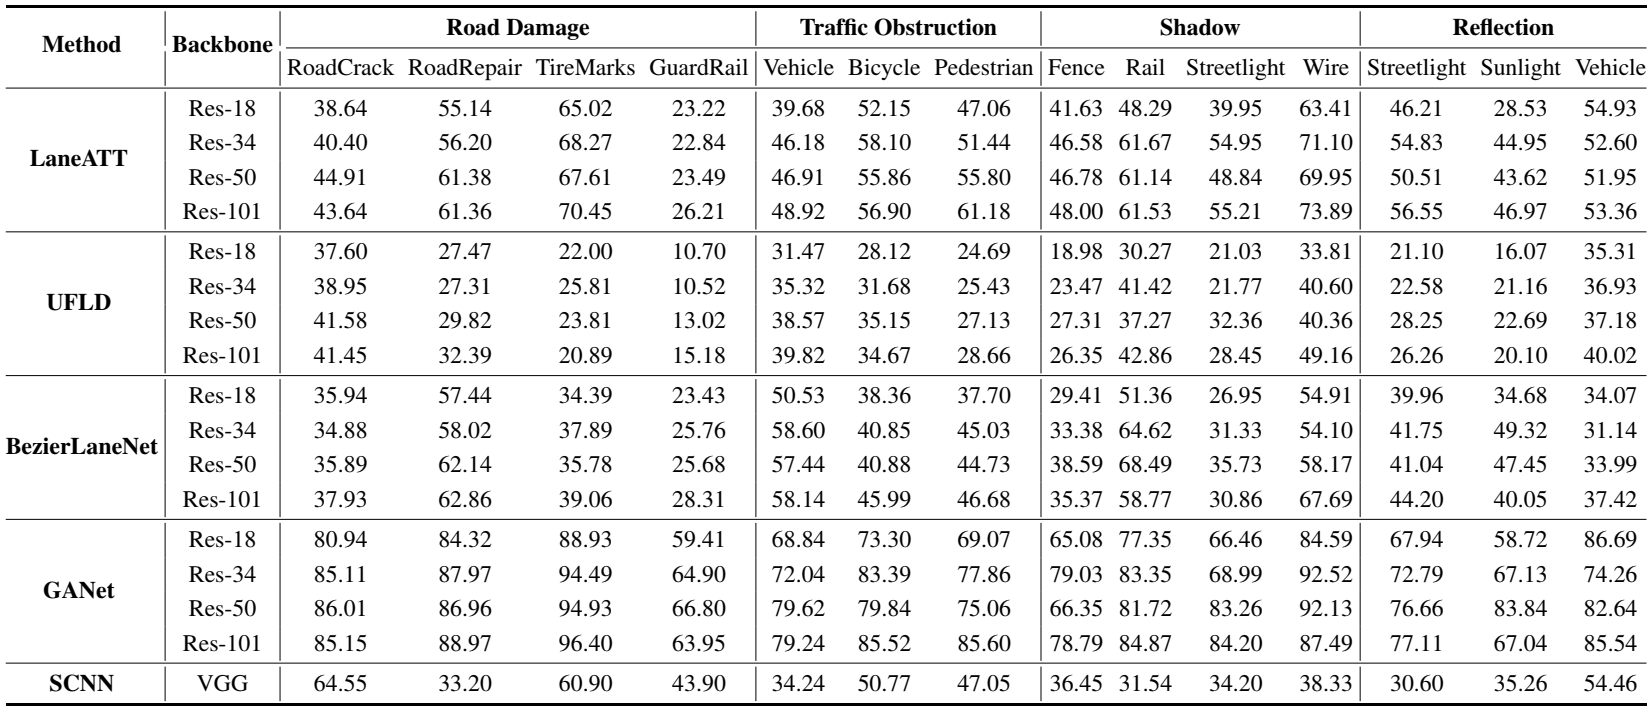
Here we show the breakdown results of 14 illusion types. Table 2 shows the breakdown results in Accuracy and F1-score drop.
| Table 2. The breakdown results of each illusion type in Accuracy and F1-score drop (%). |
|---|
(a) Accuracy drop (%).
|
(b) F1-score drop (%).
|
Table 3 shows the breakdown Accuracy results under original scenes and perturbed scenes.
| Table 3. The breakdown Accuracy results of each illusion type under original scenes and perturbed scenes (%). |
|---|
(a) Accuracy under original scenes (%).
|
(b) Accuracy under perturbed scenes (%).
|
Table 4 shows the breakdown F1-score results under original scenes and perturbed scenes.
| Table 4. The breakdown F1-score results of each illusion type under original scenes and perturbed scenes (%). |
|---|
(a) F1-score under original scenes (%).
|
(b) F1-score under perturbed scenes (%).
|
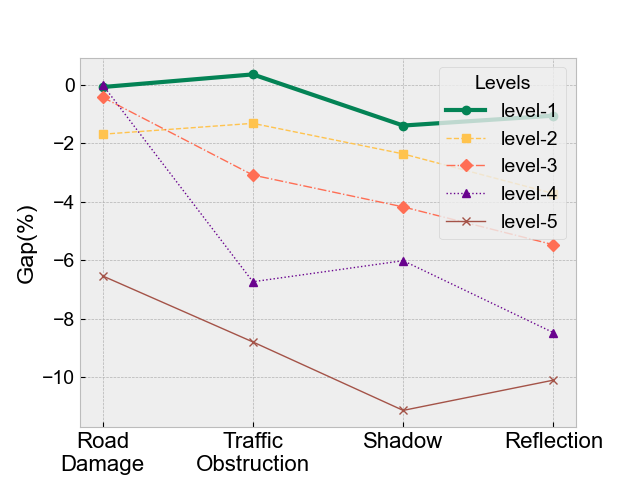
Evaluation results of 5 severity levels
Figure 1 shows the Accuracy drop of various models using ResNet-18 backbone (SCNN uses VGG backbone) across different severity levels under 4 illusion categories.
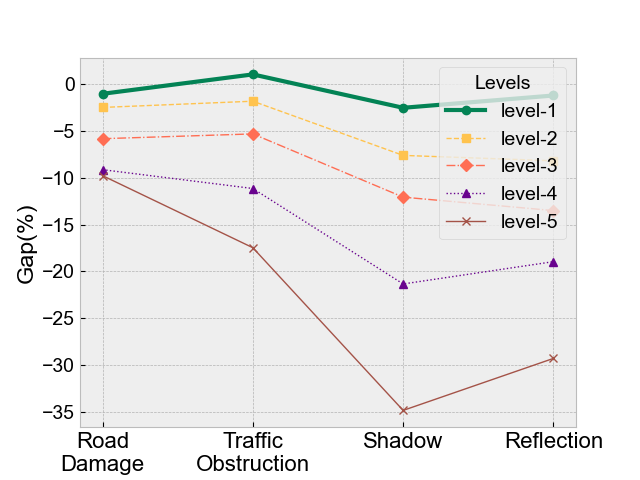 (a) GANet
|
(b) BezierLaneNet
|
(c) LaneATT
|
 (d) SCNN.
|
(e) UFLD.
|
| Figure 1. Accuracy drop across 5 severity levels(%). |